Comparison between Open Restaurants and Open Restaurants on Open Streets across 3 Metrics
Project by: Annika Nina Yu, Lance Mikhail Punay, & Zoe Lin
Poster Layout by: Zoe Lin
Class: Introduction to Urban Data and Informatics
Faculty: Boyeong Hong
Year: 2022
What are the impacts of Open Restaurants on Vehicular Crash Rates, relevant 311 Complaints, and Rodent Complaints in New York City comparing the period of March 2019 to February 2020 and July 2021 to June 2022? Additionally, to what extent does the presence of Open Restaurants on Open Streets mitigate or exacerbate these impacts?
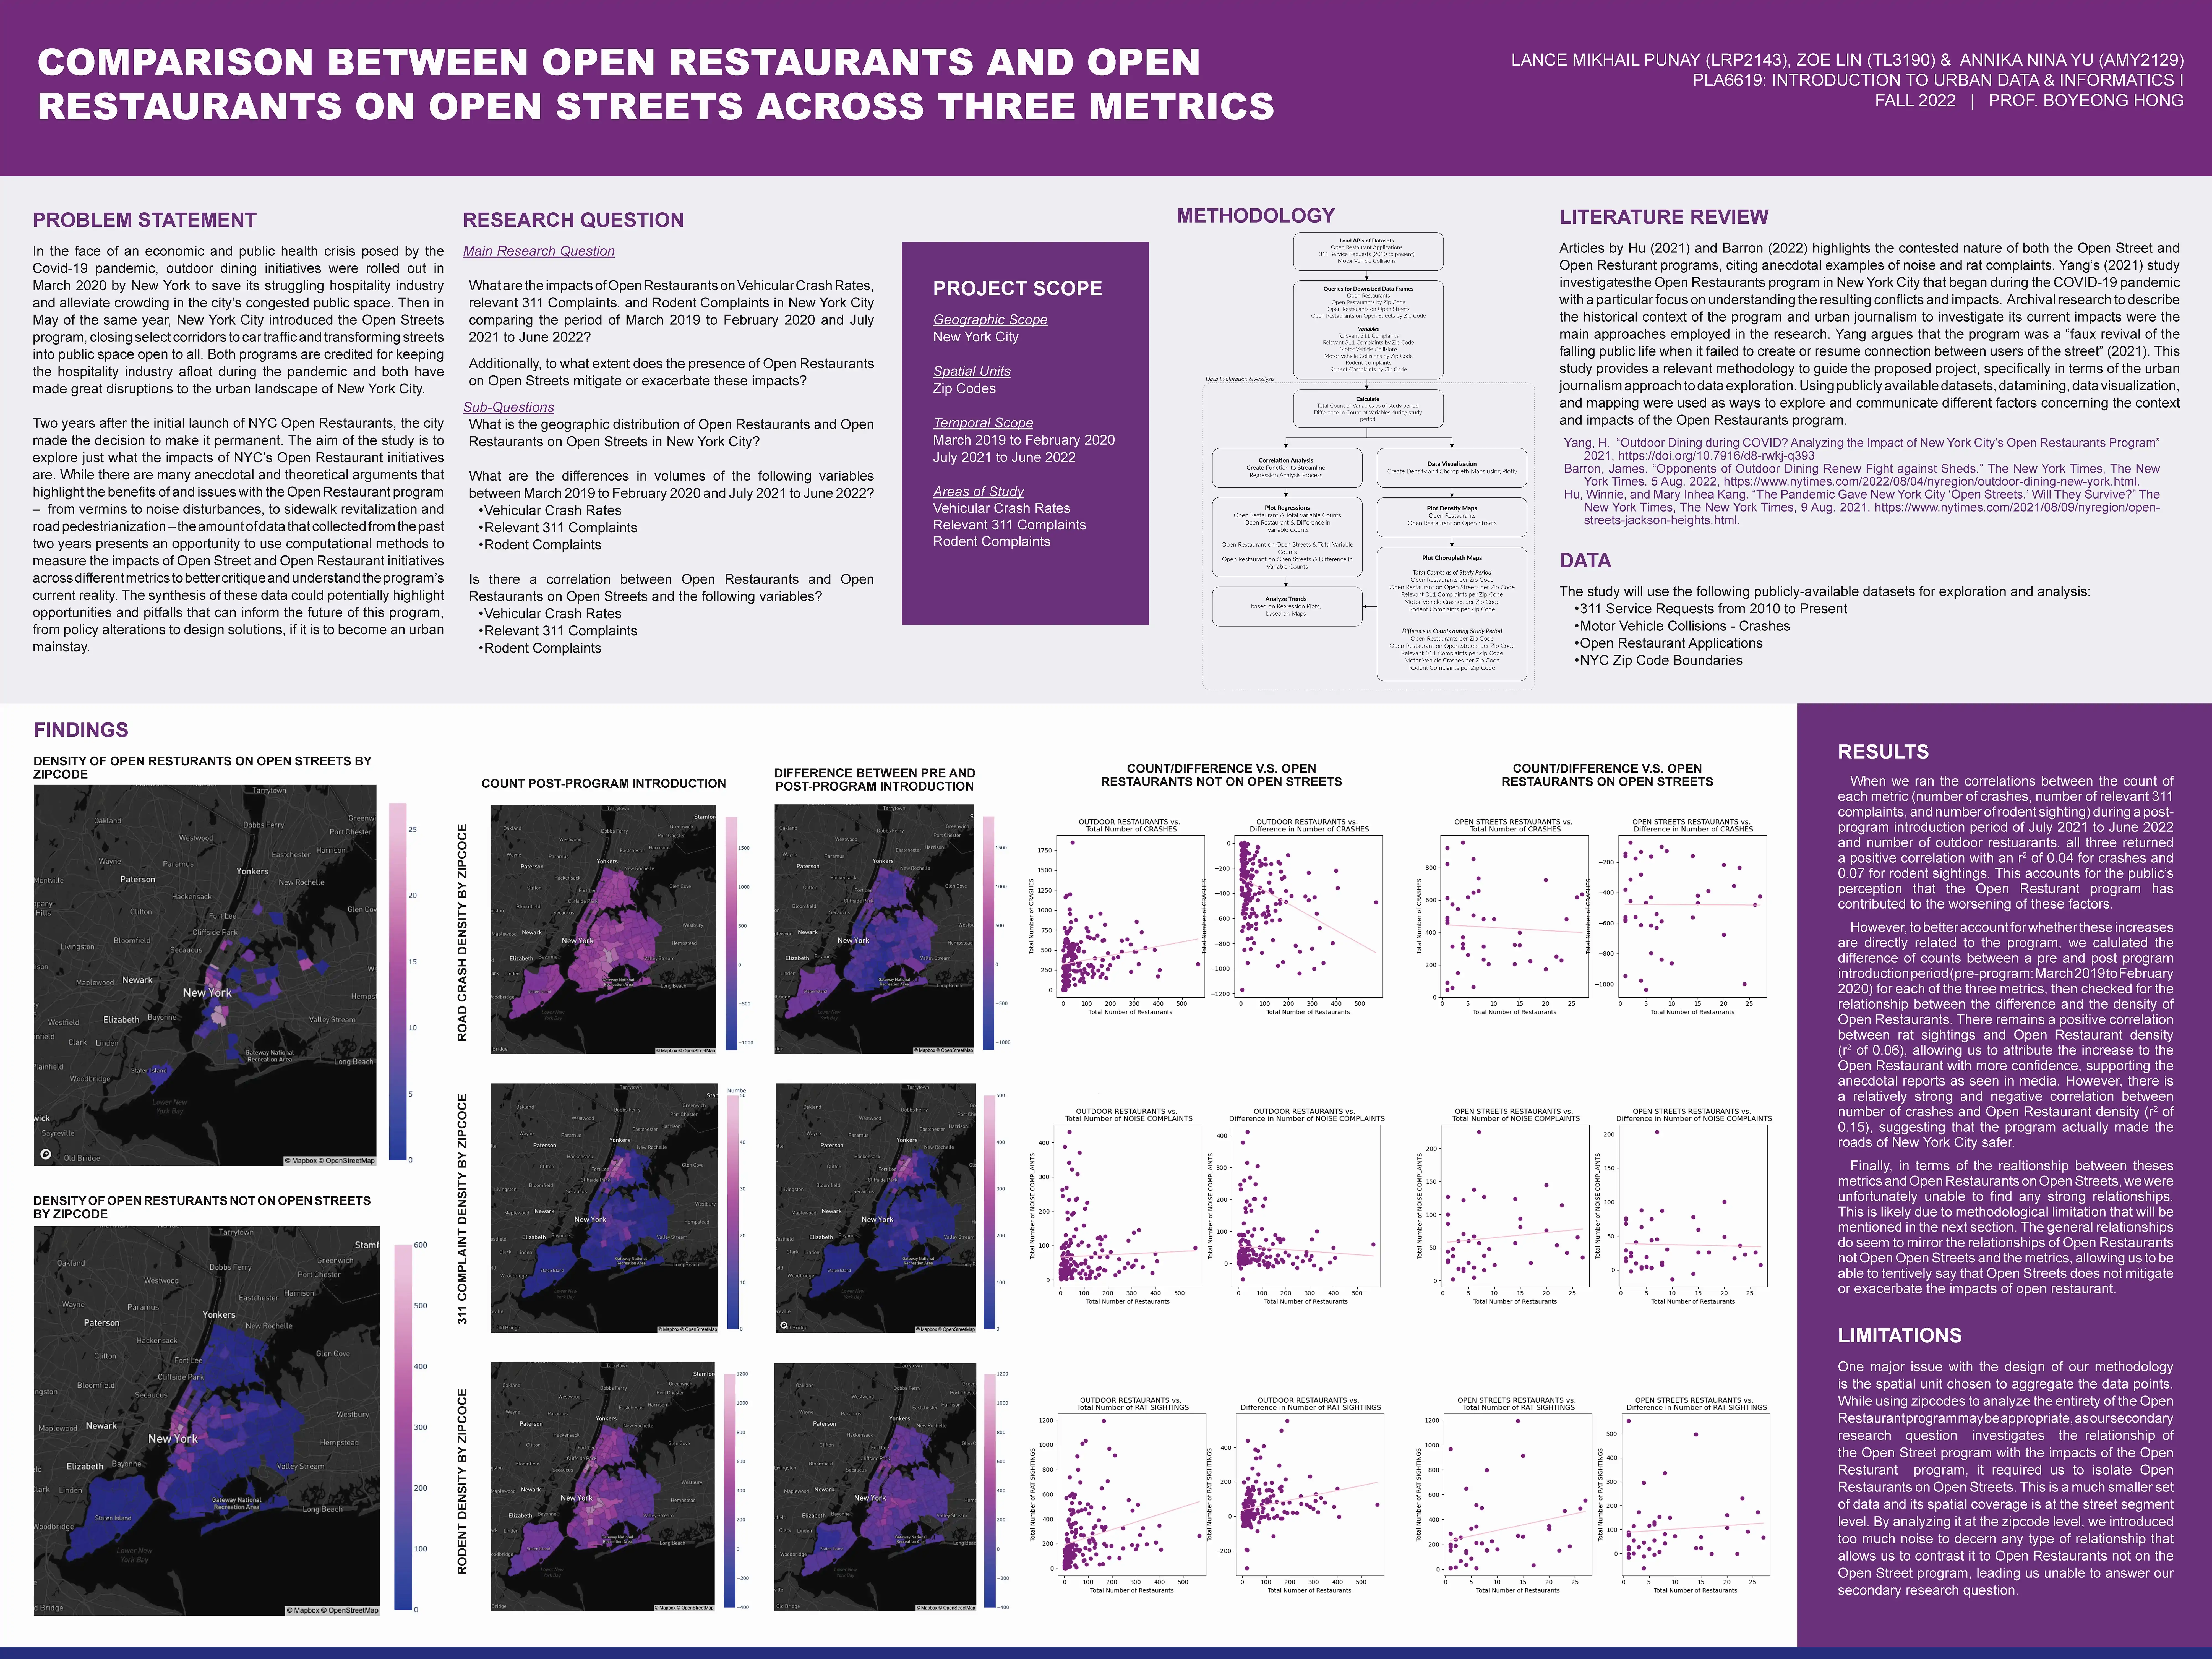
During the Covid-19 pandemic, New York City implemented outdoor dining initiatives and the Open Streets program to support the struggling hospitality industry and alleviate crowding.
Two years later, the city decided to make the Open Restaurants program permanent. This study aimed to assess the impacts of these initiatives by analyzing correlations between the data collected over the past two years using Python as well as mapping and visualization packages such as GeoPandas and Plotly respectively.
Correlations between various metrics and the number of outdoor restaurants showed a positive relationship with crashes and rodent sightings, suggesting public concerns. Notably, when comparing pre- and post-program periods, there was a positive correlation between rat sightings and Open Restaurant density, supporting anecdotal reports. Additionally, there was a negative correlation between crashes and Open Restaurant density, indicating that the program may have improved road safety. The general relationships do seem to mirror the relationships of Open Restaurants not on Open Streets and the metrics, allowing the study to tentatively claim that Open Streets do not mitigate or exacerbate the impacts of Open Restaurants.
Open Restaurants - Choropleth Map
Open Restaurants on Open Streets - Choropleth Map
Motor Vehicle Crashes - Animated Density Map
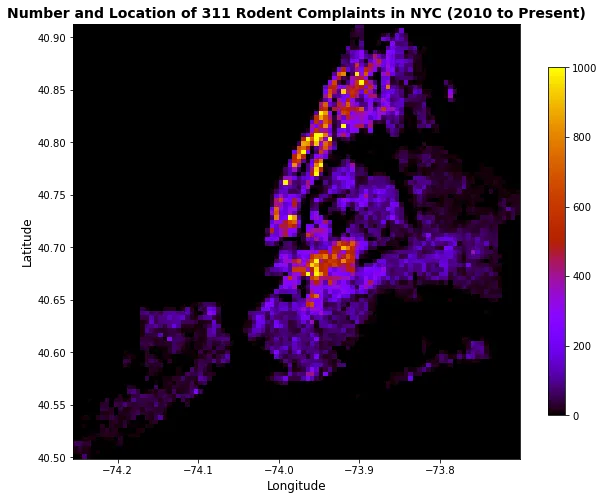
Rodent Complaints - Animated Density Map
Difference in Number of Motor Vehicle Crashes - Choropleth Map
Difference in Number of Rodent Complaints - Choropleth Map
Difference in Number of Relevant 311 Complaints - Choropleth Map